
RealTest
Diversify in Every Dimension:

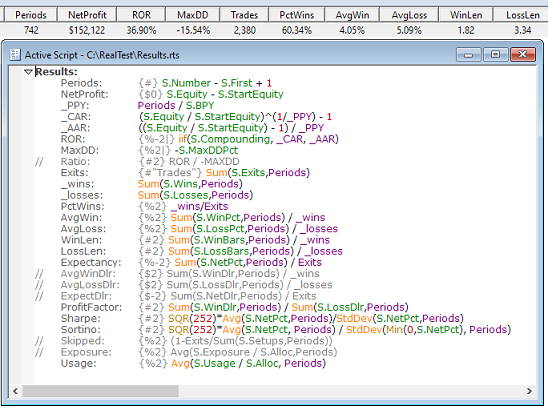
The user interface makes navigation through this data simple and intuitive.
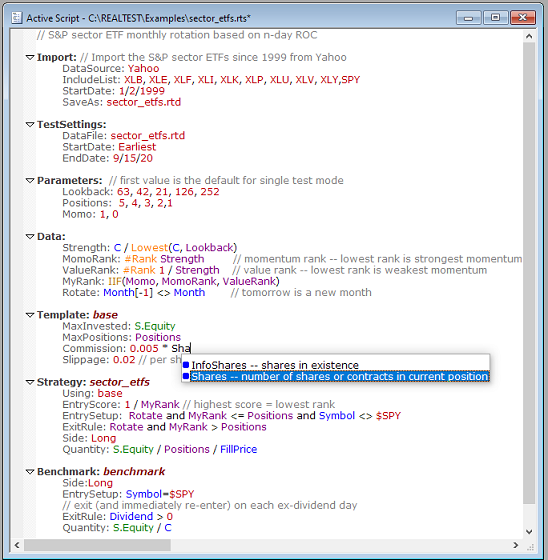
Each line of a RealTest script is essentially a parameter to a general-purpose systematic trading model.
Writing a script is like filling out a form, with helpful suggestions provided as you type.
If you can build Excel worksheets, then you can write RealTest scripts.
The powerful formula syntax is fully recursive and includes every well-known indicator, allowing any imaginable trading strategy to be tested.
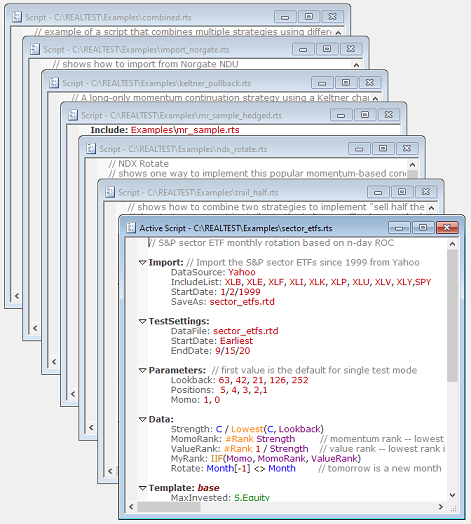
Whatever you want to test, you will find an example showing how to structure it.
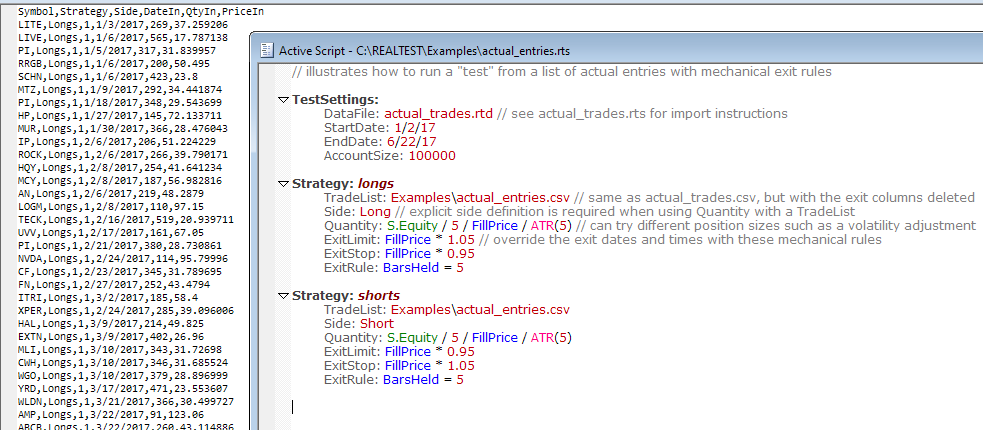
Trades can be imported as round-trip entry/exit pairs or as a transaction list.
Interactive Brokers Flex Query output is directly supported.
Imported trades can be tested as-is or with systematic rules added.
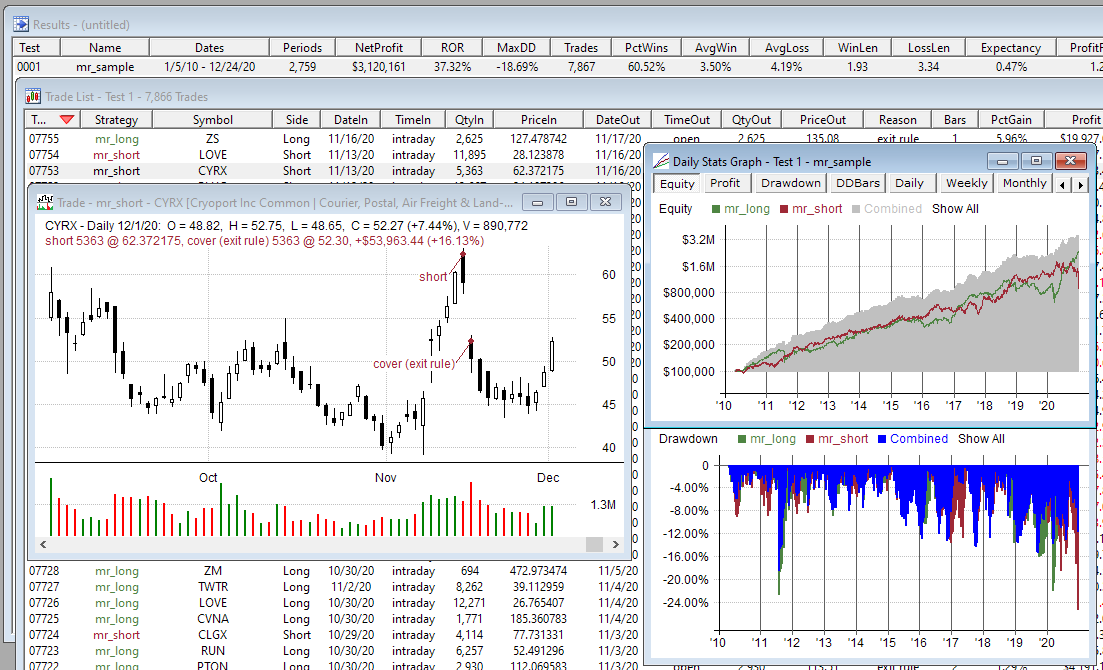
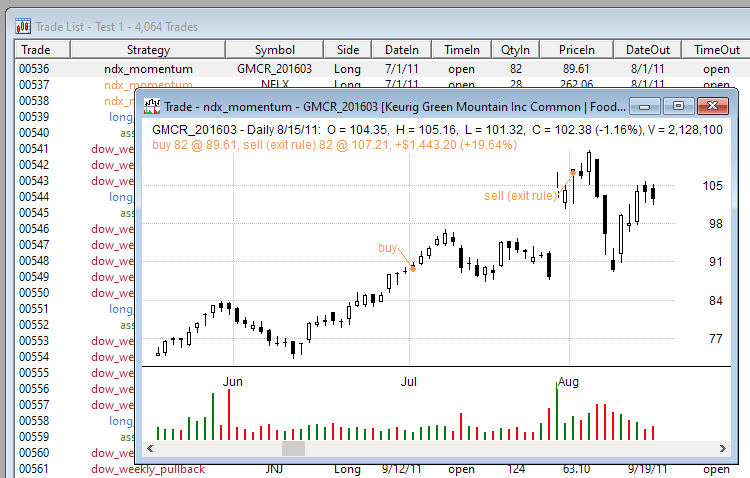
Double-clicking on a trade list row opens a chart showing the entry and exit points.
Pressing the up and down arrow keys cycles that chart through the list, making it quick and easy to review the trades of a strategy and confirm that it's doing what you intended.
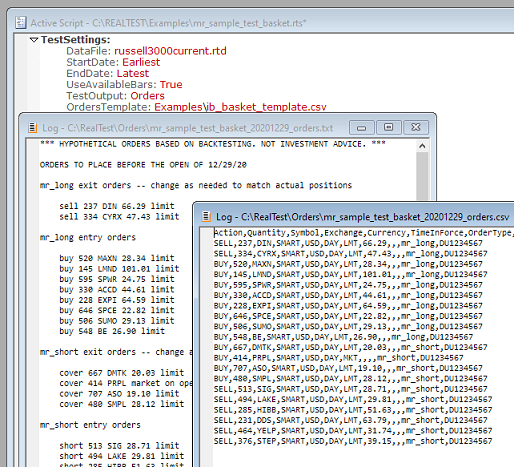
Order lists can be in either human-readable text or machine-readable CSV format.
Templates are provided for IB Basket Trader and The Chartist Smart API CSV file formats, and other formats are easy to add.
Reviewing hypothetical order lists is a great way to ensure that a strategy is structured correctly.
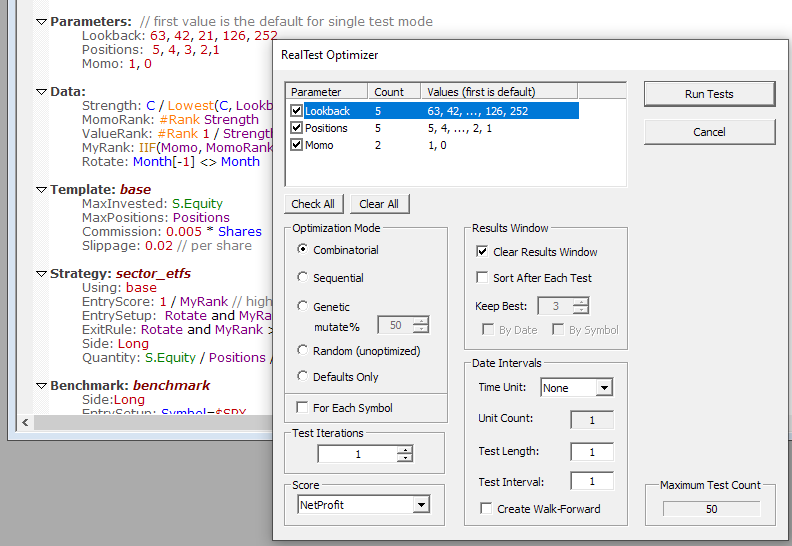
It can run interval tests and generate walk-forward parameters.
Any stat from the Results output can be used as a fitness function.
Results can all be kept, or can be sorted and pruned as tests are run.
Large parameter spaces can be traversed more quickly using Sequential or Genetic modes.
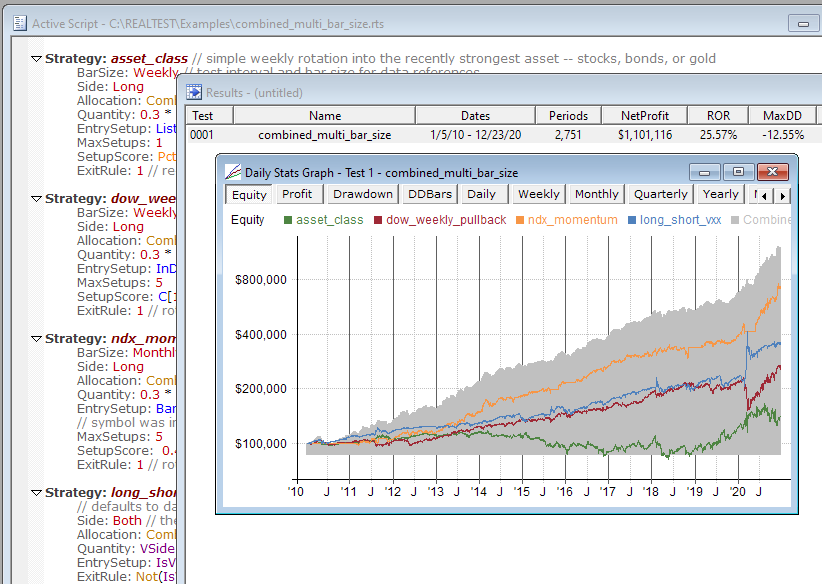
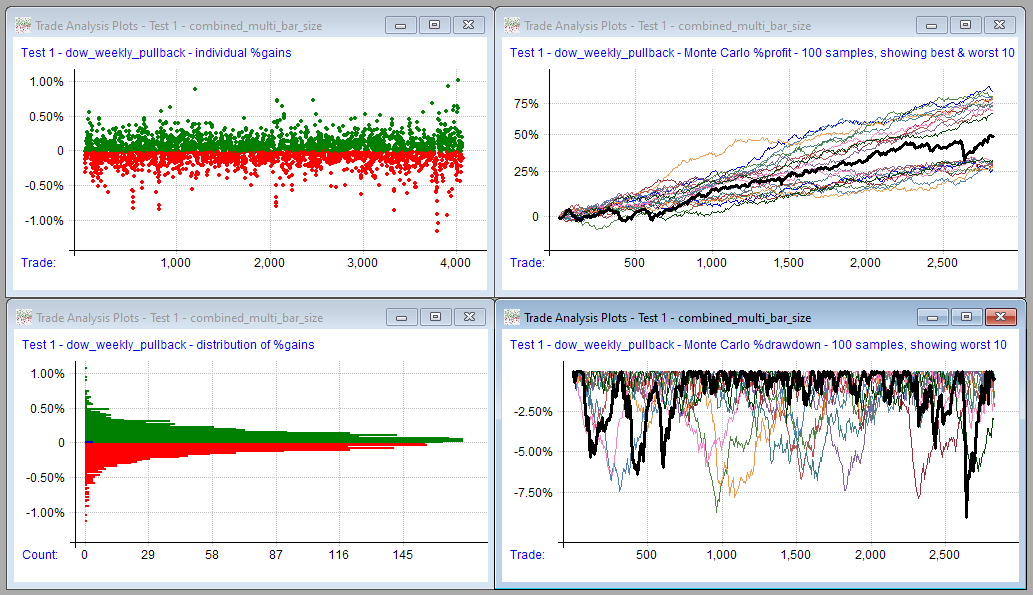
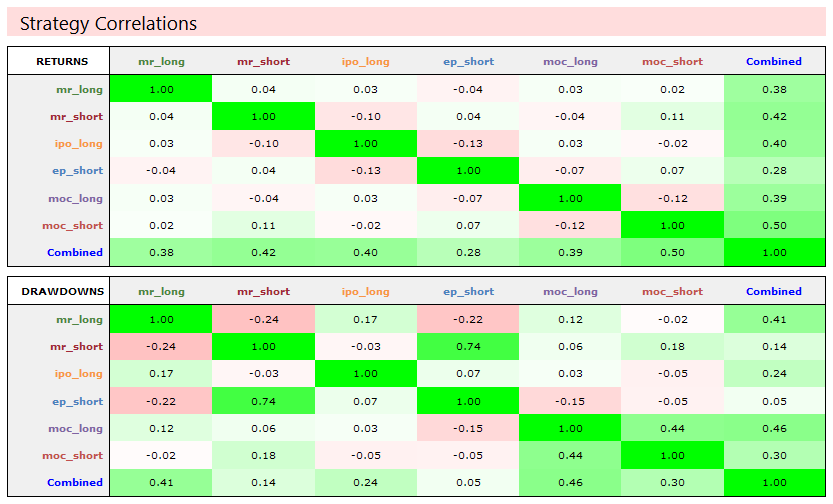
This report includes, among other things, strategy correlation matrices for both daily returns and drawdowns.
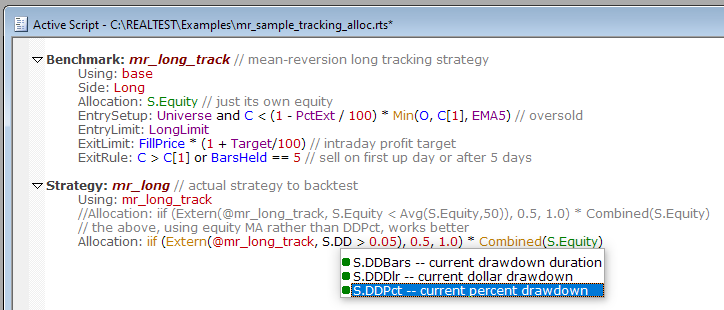
Strategy definitions can include references to their own current stats and/or those of other strategies.
This allows, for example, a Benchmark version of a strategy to be used to govern the live version.
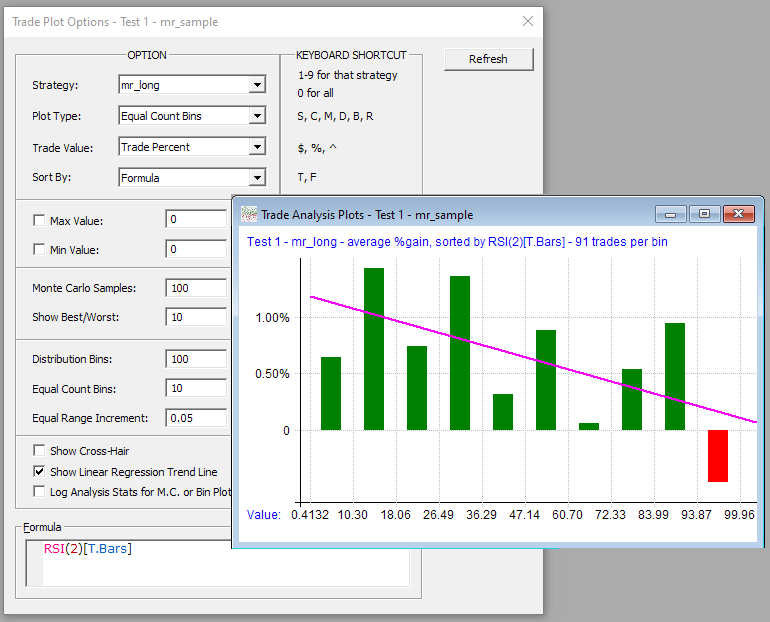
Here we see the trades from a long mean-reversion strategy grouped into equal-count bins after having been sorted by RSI(2) as of trade setup date.
It would appear that trade expectancy is correlated with this indicator.
Using the formula mini-editor and trade-level statistics, there's no limit to what can be studied here.
You can easily edit these scripts and/or temporarily override them by adding these sections to your own scripts.
Have it your way when it comes to stats reporting.