|
As we drill further down, the next level of results analysis to look at are the daily stats graphs.
Each test record in a results file includes each stat element as a daily time series rather than just a final summed value.
These results time series are also available to the test script while the test is running, allowing a strategy to dynamically refer to its own performance and/or the performance of other simultaneously running strategies. (The example script mr_tracking.rts shows how this is implemented.)
Double-clicking on a row in a results list opens the daily stats graph for that test. Here is an example from a 2-strategy system, long/short mean-reversion:
.png)
Each strategy is graphed separately with color-coded lines and labels, along with the combined system results.
Here is the drawdown graph, showing how the two sides of this long/short strategy will usually hedge each other to some degree:
.png)
Stat series lines (or bars) can be displayed for any combination of the multiple strategies that were contained in the system defined in the test script that produced this set of results.
Which strategies to display and which to hide can be specified by clicking on their names at the top of the graph:
.png)
The names switch to boldface when you hover over them to show that you can click.
The square next to each name is filled if that line is showing or hollow otherwise.
Clicking on the name of a strategy hides all other strategies except for that one.
Holding down Ctrl while clicking on the name of a strategy toggles it between shown and hidden without effecting other strategies.
Clicking "Show All" shows all the strategies plus the combined line.
Holding down Ctrl while clicking "Show All" hides all the lines.
Strategies can also be shown using the number keys: 4-9 shows only that strategy, and 0 shows only the combined line. Shift+digit adds 10, for systems with more than ten strategies. Ctrl+digit toggles a strategy on or off without affecting the others - including Ctrl+1, 2 or 3 for the first three strategies, since the plain 1, 2 and 3 keys set the pane count (see Multiple Panes below).
The data underlying a stats graph can also be easily viewed by pressing the D key or selecting Show Data from the context menu:
.png)
In every stats graph, the Y axis represents the daily values resulting from evaluating the formula for that graph, and the X axis contains the dates.
Multiple Panes
A graph window can show one, two or three stacked panes, each with its own tab bar and graph selection:
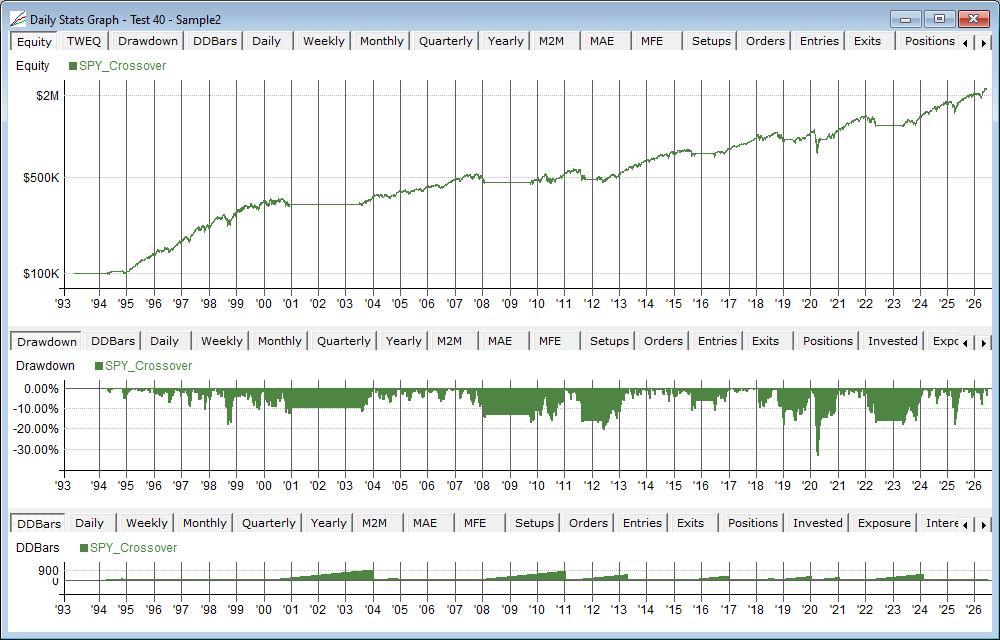
Set the pane count with the 1, 2 and 3 keys, with the Show 1, 2 or 3 Panes items on the Graph Menu, or with the Panes setting at the top of the Options dialog. The second pane initially shows Drawdown and the third DDBars; whatever graph you select in each pane is remembered.
The panes act as one window: the cursor, subset zoom (and ESC), strategy show/hide choices and the display toggles apply to every pane, and the date axes stay aligned. Drag the splitter bar between panes to adjust their relative heights, or double-click it to reset; the proportions are remembered.
Ctrl+C and Save Image capture all visible panes as a single combined image.
Stacked graphs can also appear in Test Summary Reports: a {^2} or {^3} format code in a Graphs section item stacks that graph beneath the preceding {^} graph as one combined report image with a shared date axis. See the Graphs Section topic for details.
As with results and charts, daily stats graph content is defined using the Graphs Section of a script, and all open graph windows use the same set of graph type definitions:
.png)
If the active script does not include a Graphs section, then the default script – Graphs.rts in the program directory – is applied.
To quickly access the underlying formulas for any Results, Graphs, Trades or Chart window, press the F9 key or use the context menu.
Press F4 or click Apply after modifying the graph definitions to see the result of your changes in all open graph and data table windows.
Graph Colors
Graph windows allow specification of 10 colors via the options dialog.
The first strategy that is defined in a system script gets line color 1, the second strategy line color 2, and so on.
Lines are labeled with the name of each strategy in color-coded text, so it should always be clear which is which.
If there are more than 9 strategies, strategy 10 gets color 1, strategy 11 gets color 2, etc.
Line colors can be edited using the graph options dialog:
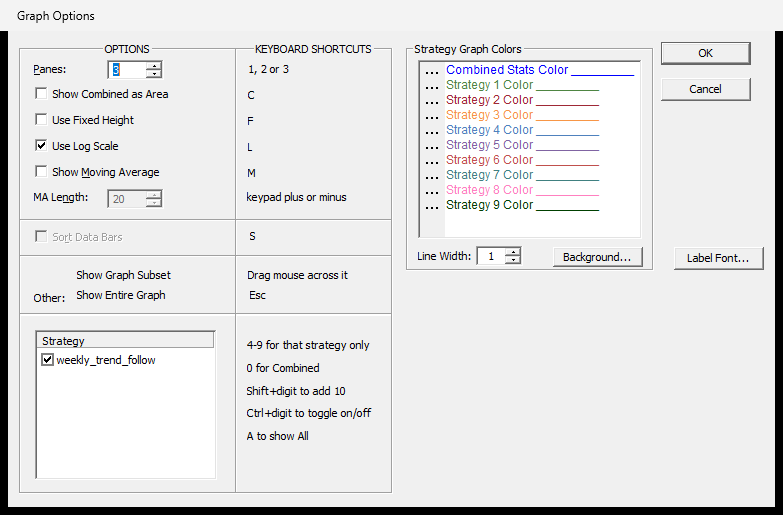
Clicking on the "…" to the left of any color opens the Windows color selection dialog.
Most of the other options in this dialog can also be accessed using the Graph Menu and/or the keyboard shortcuts listed above and on the menu items.
This and other options dialogs in RealTest also include reminders about keyboard shortcuts that can be used.
|