|
The Graph menu appears in the menu bar whenever a Stats Graph Window is active, and can also be accessed by pressing the right mouse button within that window.
Menu items with icons next to them are also accessible using the Tool Bar.
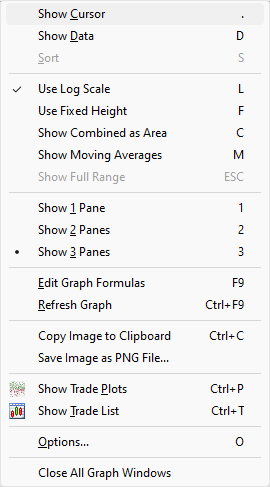
Show / Hide Cursor toggles the vertical magenta cursor bar on or off. The cursor bar makes it possible to see the data values for any specific date in the graph.
Show Data opens a new List Window showing all of the data contained in the current graph.
Sort is enabled when the current graph type is a bar graph, and can be used to toggle the bar order (X axis) between by date and by value. Sorting a bar graph by value makes it easier to see at a glance what the range of values is and how common or rare the extremes are.
Use Log Scale toggles the scaling of the price (Y) axis between arithmetic and logarithmic. Log Scale is only available when the graph type is a line graph and all the values in the graph data are greater than zero. This is most typically used for a Compounded Equity graph.
Use Fixed Height toggles whether to keep the Y axis fixed at the scale required to show all strategies at once when not all strategies are being shown.
Show Combined as Area toggles the display of the combined line for a multi-strategy graph such as Equity as a gray area behind the other lines rather than as its own line.
Show Moving Averages toggles the display of a moving average line around the graph line for each strategy. Unlike Chart Windows, Graphs do not include a mechanism for adding custom indicator lines to the existing stats. Only a simple moving average is currently supported. The length of the average is specified in the Options dialog, and can be increased or decreased using the + and - keys on the numeric keypad.
Show Full Range restores the graph to the default of showing the entire range of dates at once. It is possible to zoom in to a subset of the data by dragging the mouse across part of the graph. This item (or the ESC key) exits the subset view mode.
Show 1 / 2 / 3 Panes sets how many stacked graph panes the window contains (also the 1, 2 and 3 keys). Each pane has its own tab bar and graph selection, while the cursor, zooming and strategy choices stay synchronized across panes. See Daily Stats Graphs for details.
Edit Graph Formulas opens a script window with the script that contains the Graphs Section that was last applied to a graph. Most of the time, this will be graphs.rts unless you've recently applied a different script with a replacement Graphs section.
Refresh Graph forces all the data items to be recalculated and the contents of the graph to be redrawn.
Copy Image To Clipboard places a bitmap image of the currently displayed graph into the Windows clipboard.
Save Image As PNG File prompts for a file path to save the currently displayed graph in PNG image format.
Show Trade Plots opens a Trade Plot Window for the test behind the graph. This has the same effect as selecting this item in the Results Window.
Show Trade List opens a Trade List Window for the test behind the graph. This has the same effect as selecting this item in the Results Window.
Options opens the graph options dialog box.
|